Overview
Use SheetXAI to compare each lead's spreadsheet information with your ideal customer profile (ICP). Define the criteria and scoring scale, then ask the agent to return a score, a rationale tied to the row, and the biggest missing or mismatched criterion. For a bulk list, a subagent handles an individual row using your rubric and returns the result to that row. These outputs help organize research and prioritization; they do not establish a prospect's intent or probability of buying.
Set up the lead table and rubric
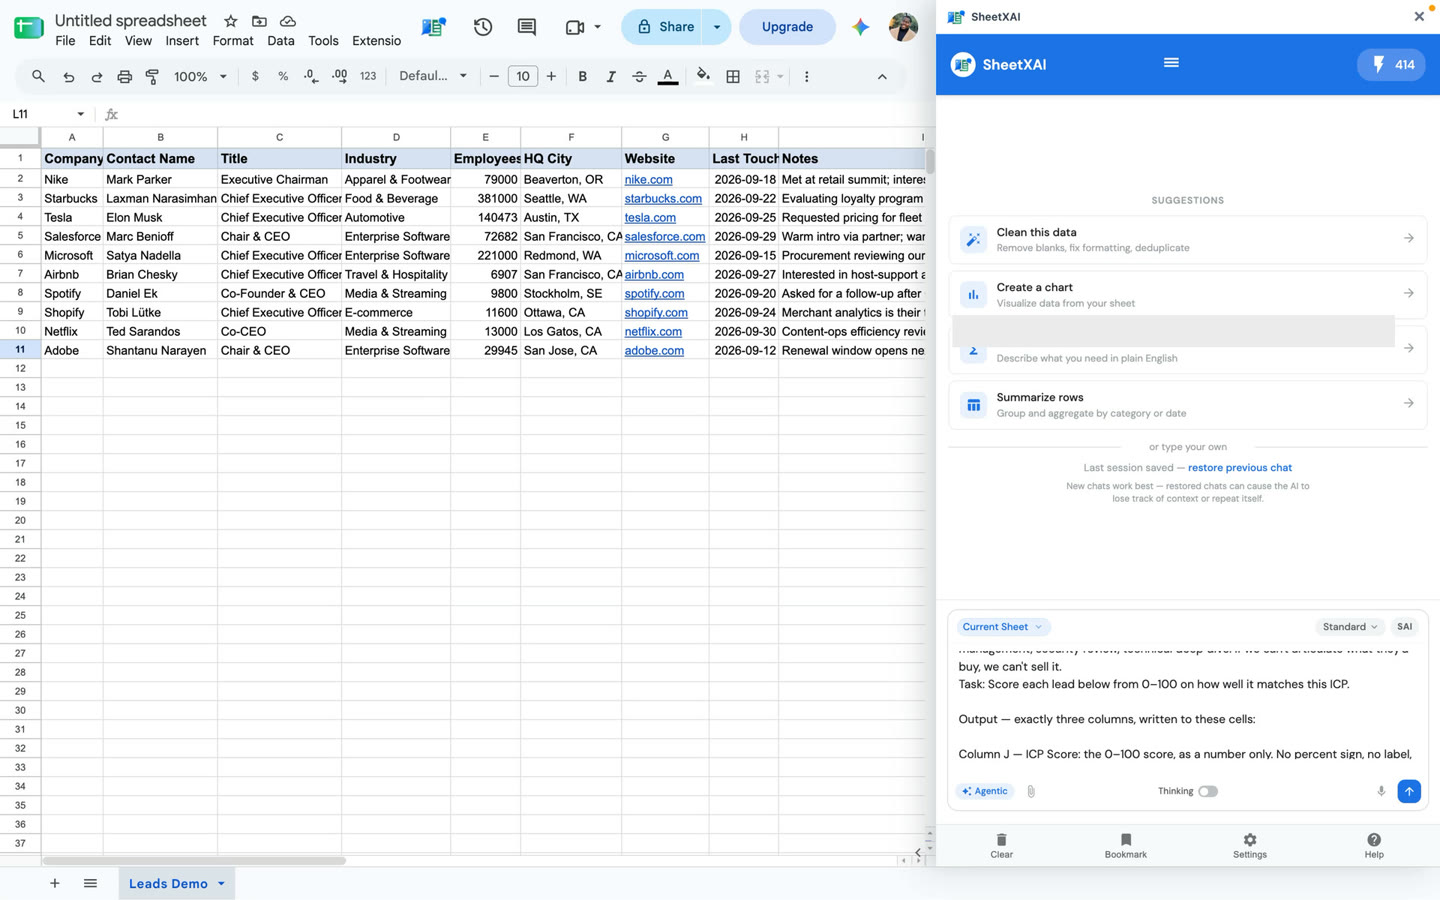
Keep one lead per row, with clearly labeled columns for the facts you want considered. Include relevant company, contact, and lead-context fields. Add three output columns:
- ICP Score
- Rationale
- Biggest Gap
Write your ICP as criteria that can be applied consistently. An example rubric might consider company scale, target industry, headquarters region, access to a decision maker, buying intent, and recent engagement. Choose criteria that fit your market, and specify which ones are required versus preferred. Avoid asking the agent to infer facts that are not present in the row.
Run a scoring pass
Use this copyable prompt as a template. Supply your own ICP, score scale, and column names:
Use subagents to evaluate the leads row by row against this ideal customer profile: [describe your ICP and any priorities or scoring rules]. For each row, write an ICP score in the ICP Score column, explain the score using the lead information in the Rationale column, and identify the most important missing or mismatched criterion in the Biggest Gap column. Do not assume facts that are not present in the row.
- Select a few leads and submit the task for a sample run, naming the input fields and all three output columns.
- Check that each score uses the same scale and criteria. Confirm that the rationale explains the score and the biggest gap is supported by the row.
- Clarify the rubric if two similar leads receive inconsistent scores or if the agent treats a preferred criterion as mandatory.
- Once the sample is consistent, ask SheetXAI to process the remaining selected rows.
- Review the resulting scores and correct or rerun rows affected by missing, stale, or misunderstood information.
Interpret the outputs
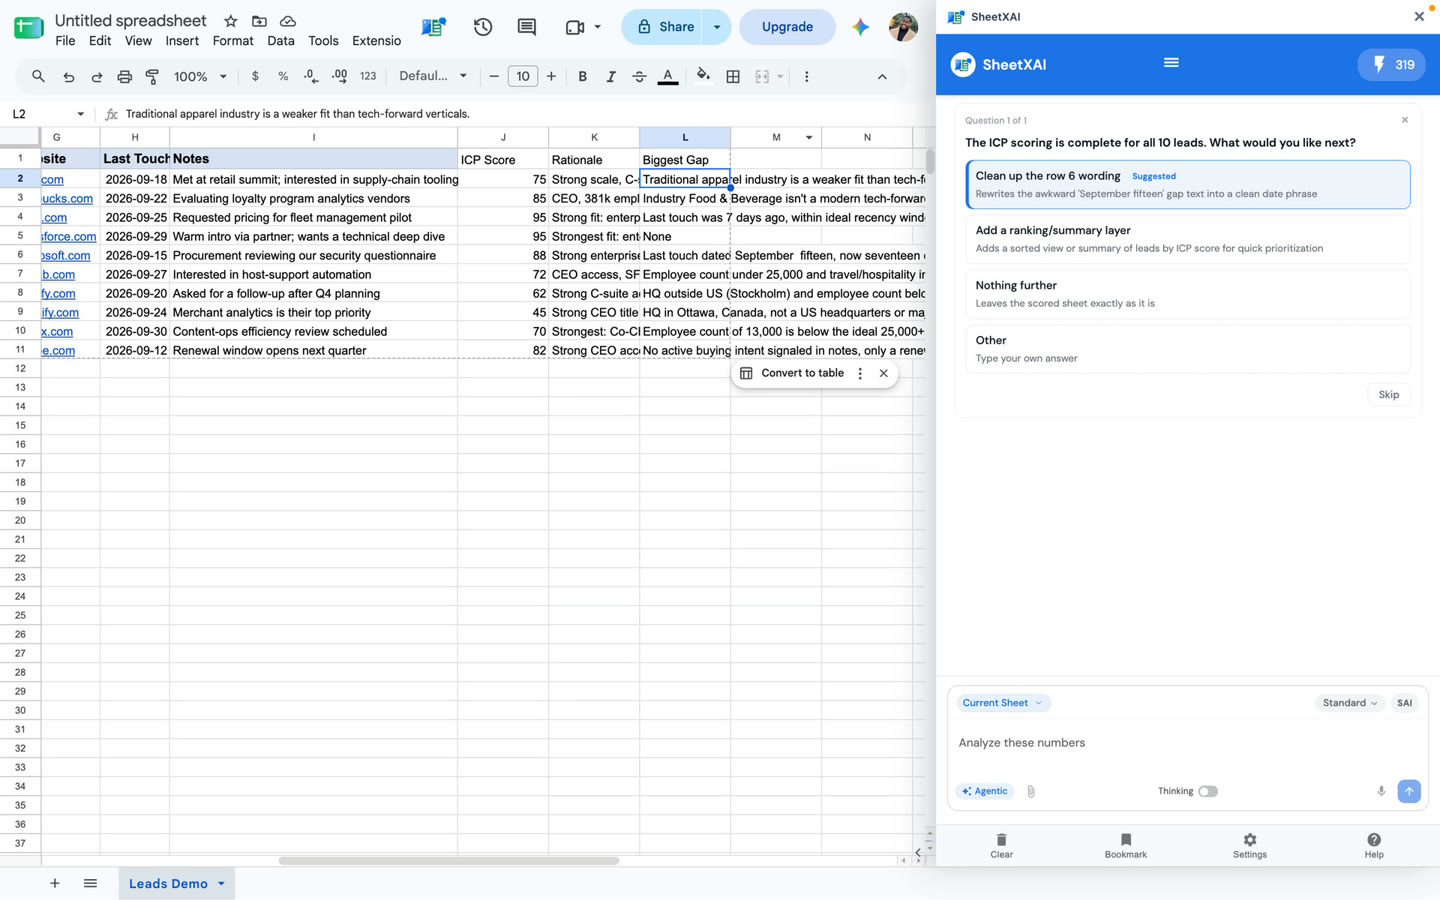
Treat the score as a sorting or triage aid, not a probability of purchase or a validated prediction. A rationale makes the result reviewable, but it does not prove that the underlying lead facts are true. Verify important facts against their sources and revisit the prompt if the rubric is applied inconsistently.
Do not use an unexplained generated score as the sole basis for a consequential decision. The screenshot accompanying this example uses mock data; it is not a result about actual prospects.
Troubleshooting
- Scores vary for similar leads: Make the scoring scale and criteria more explicit, and compare several reviewed examples.
- A rationale uses unsupported details: Remove or verify those facts, then ask the model to rely only on supplied fields.
- The biggest gap seems wrong: Check whether the needed criterion appears in the input row and clarify what should count as missing versus mismatched.
- A lead has too little information: Treat the score as provisional or gather better evidence before prioritizing.
Replacing Clay series
Continue in order: